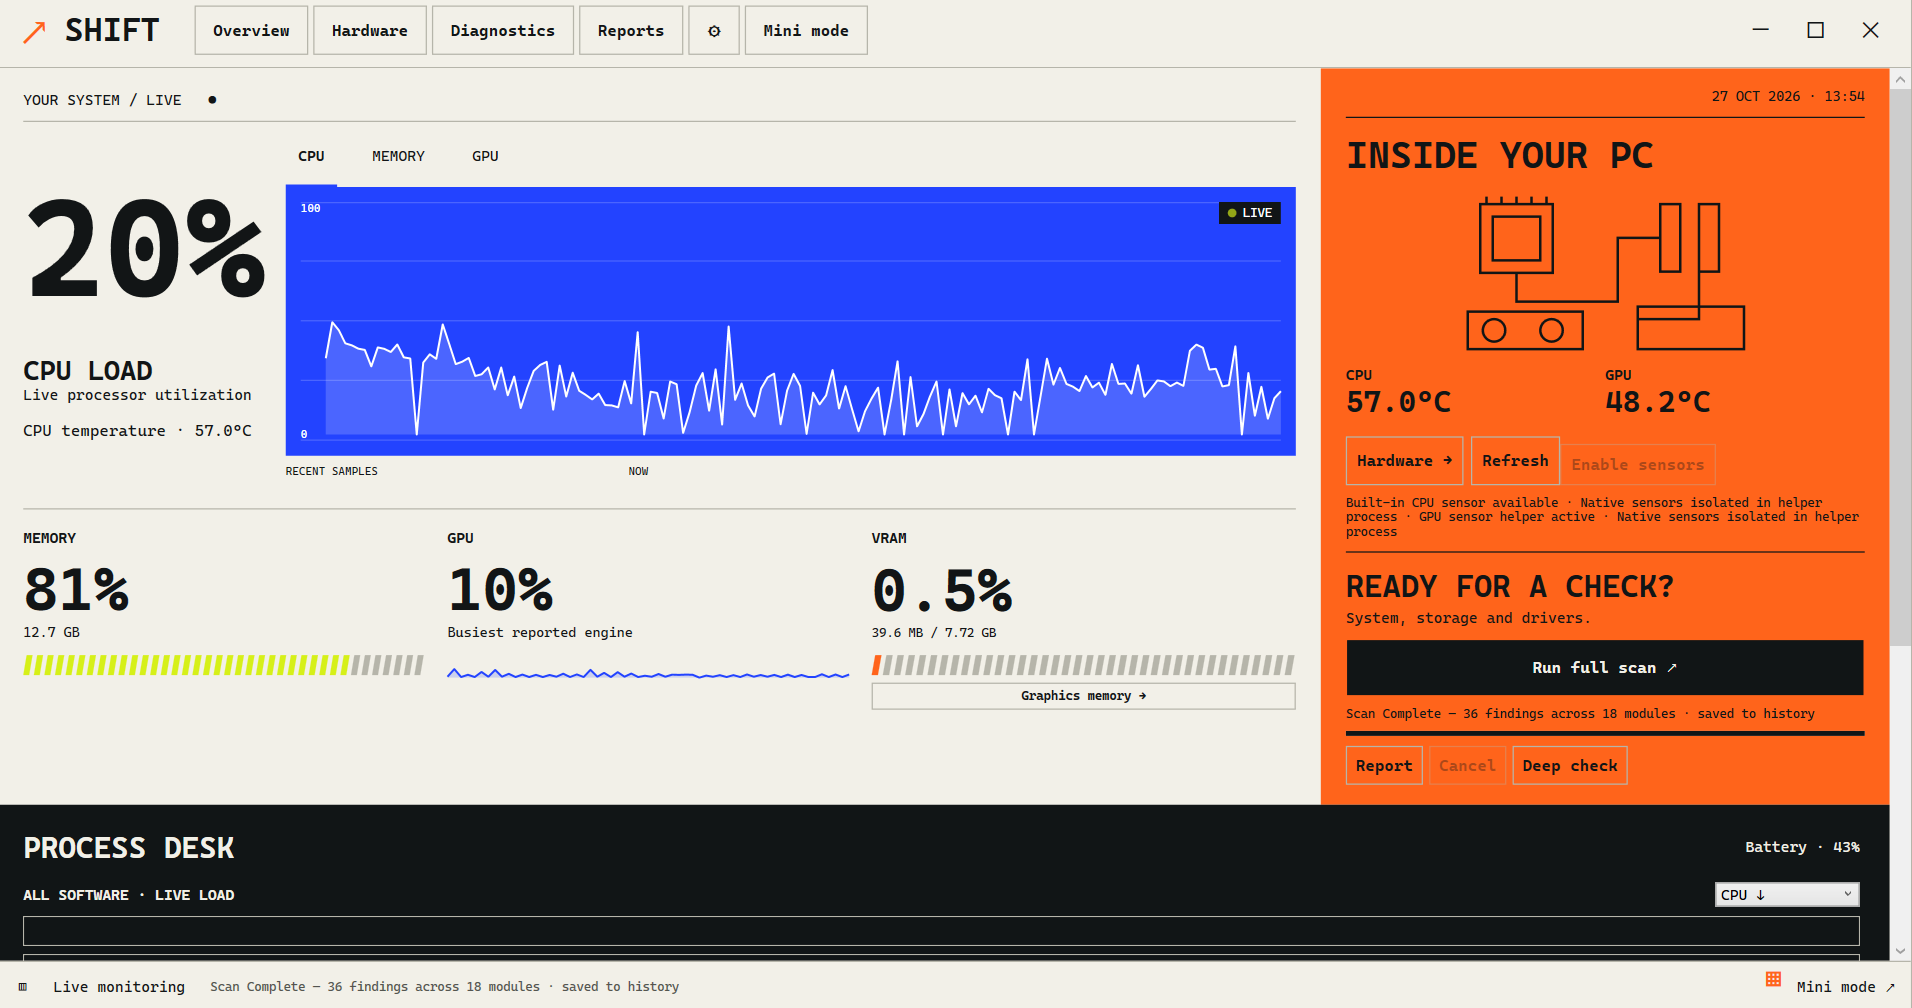
To investigate a slow Windows PC, watch resource use while the slowdown is happening. CPU, GPU and RAM readings show what the computer is doing at that moment. They help you choose the next check; a high percentage by itself does not identify a faulty component.
SHIFT brings CPU, supported GPU readings, RAM, VRAM and other available information into one view. It supports Windows 10 and 11, with x64, x86 and ARM64 builds. This guide explains how to collect a useful observation without treating every busy reading as a problem.
Start with the task that feels slow
Write down what is happening: an app opening slowly, a game stuttering, a video export taking longer, or the whole desktop becoming unresponsive. Record which apps are open and whether the problem starts immediately or after some time.
Open SHIFT before repeating that task. Keep the workload similar when comparing two observations. A reading taken during an export and one taken with every app closed describe different conditions, so they are not a useful before-and-after test on their own.
You can also use Windows Task Manager as a built-in starting point. Microsoft recommends reviewing CPU, memory and disk activity when investigating slow performance. Press Ctrl + Shift + Esc to open it, then review the Processes and Performance views. Microsoft's Windows performance guidance
Know what each reading can tell you
| Reading | What to look for in SHIFT | What it does not establish |
|---|---|---|
| CPU usage | Whether processor use rises with the task and remains elevated while the slowdown continues | That the processor is damaged or needs replacing |
| GPU usage | Activity reported by the supported graphics provider; choose the adapter you intend to inspect | A complete explanation of every graphics bottleneck |
| RAM | Available physical memory, memory use and the memory Windows reserves | That a high used-memory percentage is a memory fault |
| VRAM | Dedicated graphics-memory use and capacity, with shared memory shown separately where available | That shared memory and dedicated VRAM are interchangeable |
| Disk activity | Transfer speed, response time and queued requests alongside the task | That a busy disk is necessarily failing |
| Temperatures | Available readings from supported sensors | A universal safe temperature limit for every component |
SHIFT's feature directory explains the available checks and their limits. See PC monitoring and diagnostic features before relying on a particular sensor or counter.
Read the pattern, then look at the app
Use the live dashboard to see which resource changes when the symptom appears. Performance graphs can help distinguish a brief spike from a sustained pattern. SHIFT's per-app view shows CPU, supported GPU resources and private memory for running software.
For example, if the PC becomes slow only while one application is doing work, record that application's activity alongside the system reading. That is evidence to investigate the workload further, not proof that the application or hardware is defective. Avoid closing unfamiliar Windows processes just to make the numbers lower.
If memory use grows over time, SHIFT includes a memory-growth check that watches an app for a short period. Save what you observed and how long the app had been open. A short observation can suggest a direction for further investigation, but it does not prove a memory leak.
When GPU or temperature information is missing
Available readings depend on hardware, drivers, the data provider and permissions. A blank or unavailable reading is not the same as zero activity. Check that the intended adapter is selected and review any availability or permission explanation before interpreting the result.
Microsoft's description of Task Manager GPU monitoring also makes clear that GPU information depends on the Windows graphics driver model and supported driver data. Different tools can present different counters; make sure you are comparing the same adapter and type of activity. Microsoft's explanation of GPU data in Task Manager
Save evidence before changing settings
Once you can describe the pattern, record the task, time, affected app, SHIFT version and Windows version. SHIFT supports monitoring logs and report exports, including standard findings and graphical scan-history reports. Choose the export appropriate to what you checked; do not assume every live graph is included in every report.
If you need a broader check, review the diagnostic modules and whether each completed, was partial or was unavailable. Keep resource observations separate from diagnostic findings. SHIFT's diagnostic scores summarize checks; they do not measure physical hardware damage.
Close an unused app normally when appropriate, then repeat the same task to see whether the symptom changes. For further steps, follow the app or hardware vendor's documentation. Changes to drivers, power settings or optional repair actions should follow the evidence rather than a single busy reading.
What to send when asking for help
Include a short description of the slowdown, the task that triggers it, relevant readings and a saved report if useful. Review exported information for names, file paths and device details before sharing it. SHIFT's privacy options can remove common identifiers from supported exports, but you should still inspect the file.
Use the SHIFT setup guide if you have not opened the app yet, or contact support with a specific observation. If the computer is restarting or showing a stop error, collect Windows crash-history evidence instead of trying to infer the cause from current resource use.